Header image is D700 noise tests by Carl Jones used under license CC BY-NC
A couple of weeks ago I jumped in an old van with AS, MN, PT, and VDK to embark on a road trip to Rochester (don’t judge me) for the RIT hockey analytics conference (okay, now you can judge me). It was only one night and one day, but I think it’s safe to say we got the most out of our Rochester experience.
 Less creepy than our actual hotel
Image from Mr. Littlehand used under licence CC BY
What do people do at a HAC? We sit in a big room and listen to talks. Micah Blake McCurdy had a brilliant analytical foray into zone starts, David Johnson made a compelling argument about the consistency of competing metrics, Matthew Coller was immensely entertaining, and lots of other curious and creative minds shared their research and contributed to a great event.
The idea that spawned my present rambling came from Nick Mercadante, who has developed a neat goaltender summary stat. Afterwards I’m sure everyone there was left with one question in mind:
Is Steve Mason really the top goalie in the NHL?
 Spoiler alert: No
I’m going to take my shot (shot, get it?) at this question, building upon existing methods. But before I go into that, let me break down why this is worth looking into.
Evaluating goalies
In hockey the goalie is the guy who stands in a little semi-circle and tries to get hit with as many speeding rubber discs of death as he can. When they get past him, that’s a goal and it’s bad for him and his team. It’s a very important job, so teams actually want to know how good a goalie is relative to his peers. They want to know who their best goalie is, or know how much to pay for the services of other goalies out there. And fans care.
So how do you judge a goalie? When I was a kid it was all about Goals Against Average (GAA), which is the amount of goals a goalie lets in per 60 minutes played (the length of a standard hockey game). But this has obvious problems. If two goalies are equally good at stopping shots but one faces 20 per game and one faces 30, then the first will have a much lower GAA.
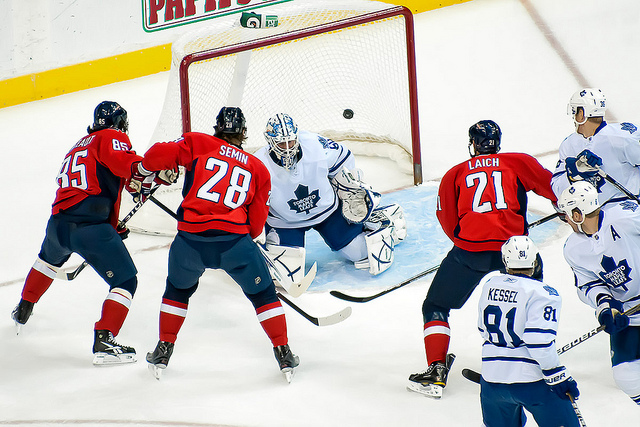 Notice the absence of defence around this poor Leafs goaltender
Now the general media uses save percentage, which is the percentage of shots (which in hockey parlance exclude blocks by other players) that a goalie stops. This should be a better metric of how well the goalie protects his net against shots directed at him. Save percentage is not quite as easy to visualize as GAA, but it has the advantage that it controls for shot counts. However, there are still issues. Perhaps some shots are tougher to stop than others. For example, if powerplay shots are difficult because they’re more selective and less rushed, then save percentage would undervalue goalies whose teams take lots of penalties.
We need to think about whether there is such a thing as shot difficulty, and how to measure it.
These may seem like minor details, but these days so many goalies are so good that they’re separated by tiny margins in their save percentages. The differences could easily be overwhelmed by team effects. War on Ice has done fantastic work with shot location data to categorize the points from which a shot is taken into three difficulty categories. Their adjusted save percentage (AdSv%) takes this into account by controlling for the proportion in each, as if every goalie faced the same proportion of shot difficulty as every other goalie. I think we can build on this concept (and on their incredibly helpful data) and go further.
Extending the method to include shorthanded shots
Follow along with the source code, which I’ve put on github. In there I have an IPython notebook, and the same code dumped as Python source, with some clutter removed (but with lots of clutter left in there for your enjoyment).
Nick Mercadante’s take on it is to take the 5-on-5 numbers (5v5) and then turn the value into goals above (or below) replacement per 60 minutes, so that we have a more interpretable number. By doing it on 5v5 Nick avoids the problem of how to deal with disproportional time in other situations. As he points out, many of the ways we evaluate teams are about their 5v5 performance.
I have conflicting thoughts about this. On one hand, I concur with the goal (goal, get it?) of controlling for these substantial factors that will out-weigh the effect we are trying to measure. On the other hand, I don’t like to set data aside. I wish I could remember how Micah Blake McCurdy so eloquently phrased the same point, but instead I’ll quote Andrew Gelman et al, who say “throwing away data is a no-no” and we should “use all relevant information; the pattern of what has been observed can be informative.”
Take a look at the below graph. This is the aggregate shot-faced distribution.
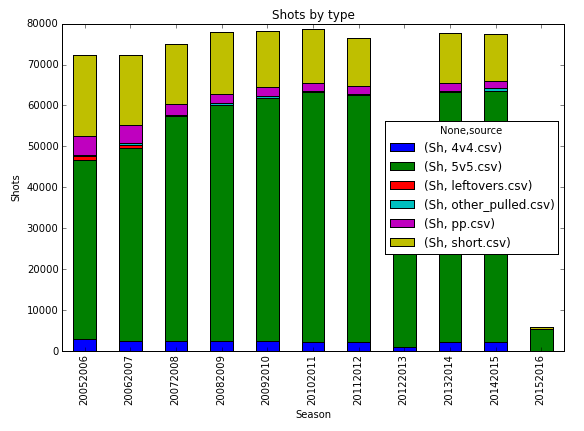 Shorthanded shots are very substantial
See that mass of yellow? Those are shots faced when shorthanded, when your team is playing at a disadvantage. There are two reasons why I want to find a way to include this:
- This gives us more data.
- This gives us a broader scope of data. If shorthanded goalie quality varies, then this gives us new information about which goalies are better and which are worse.
We can easily make the case that shorthanded shots are tougher, by breaking down save percentages into situation and difficulty.
| Situation | Save % Easy | Save % Medium | Save % Hard |
|---|---|---|---|
| Even Strength | 97.4% | 92.8% | 82.5% |
| Shorthanded | 93.7% | 87.7% | 77.3% |
How do we incorporate shorthanded shots into our analysis? We don’t want to look at them separately. We want to get at just one number, something simple that we can look at to totally and naively judge all of the outstanding athletes who play goal in the NHL.
There’s a really simple way to do it, which is to include shorthanded shots, while controlling for shot location and whether the shot is from 5v5 or shorthanded. Essentially I’d be taking the exact same weighting methodology used for adjusted save percentage, and apply it across every location-situation grouping (such as medium difficulty in 5v5), rather than just across locations within each situation separately. Just like how adjusted save percentage treats every goalie as if they face the same proportion of shots from each difficulty location, we can treat every goalie as if they face the same proportion of shots from each difficulty location within both 5v5 and shorthanded situations. Just like we did for location, we can net out (net out, get it? I crack myself up) the effect of situation.
 Nobody else is cracked up
If we were already willing to accept that on 5v5 each goalie is facing the same difficulty of shots once you look within difficulty regions, then we can accept that the same holds true for shorthanded situations. We do have less sample shorthanded, since that is a smaller chunk of the shots, but for the goalies who play substantial time it is more than enough to make reasonable conclusions from all three difficulty zones.
This actually works out really well. After generating the numbers (see the code for reference), we can notice that in 2014-2015 Steve Mason falls a bit from his lofty perch.
| Name | TOI | AdSv% | Rank | With Shorthanded | Rank |
|---|---|---|---|---|---|
| Andrew.Hammond | 1205.6 | 93.48 | 5 | 93.37 | 1 |
| Cory.Schneider | 3163.4 | 93.5 | 4 | 92.95 | 2 |
| Carey.Price | 3777.9 | 94.03 | 2 | 92.9 | 3 |
| Marc-Andre.Fleury | 3186.1 | 93.09 | 9 | 92.79 | 4 |
| Steve.Mason | 2296.4 | 94.25 | 1 | 92.73 | 5 |
| Craig.Anderson | 1796.7 | 93.54 | 3 | 92.6 | 6 |
| Devan.Dubnyk | 3190.4 | 93.13 | 6 | 92.55 | 7 |
| Corey.Crawford | 3712 | 93.09 | 8 | 92.41 | 8 |
| Semyon.Varlamov | 2648.5 | 92.04 | 32 | 92.41 | 9 |
| Braden.Holtby | 4048 | 92.96 | 10 | 92.37 | 10 |
| Ondrej.Pavelec | 2335.3 | 92.87 | 12 | 92.2 | 11 |
| Cam.Talbot | 1689.5 | 93.1 | 7 | 92.06 | 12 |
| Eddie.Lack | 1998.2 | 92.58 | 18 | 92.04 | 13 |
| Petr.Mrazek | 1521.3 | 92.37 | 24 | 92 | 14 |
| Ben.Bishop | 3890.6 | 92.41 | 23 | 91.99 | 15 |
| Pekka.Rinne | 3441.2 | 92.84 | 13 | 91.82 | 16 |
| Tuukka.Rask | 3265.4 | 92.63 | 17 | 91.72 | 17 |
| Jonathan.Bernier | 2460 | 92.45 | 21 | 91.7 | 18 |
| Jaroslav.Halak | 3245.2 | 92.69 | 16 | 91.68 | 19 |
| Jonathan.Quick | 3351.3 | 92.72 | 15 | 91.65 | 20 |
| Roberto.Luongo | 2793.5 | 92.55 | 19 | 91.55 | 21 |
| Henrik.Lundqvist | 3181.4 | 92.9 | 11 | 91.55 | 22 |
| Michal.Neuvirth | 1484.5 | 92.5 | 20 | 91.52 | 23 |
| Sergei.Bobrovsky | 2329.3 | 92.24 | 27 | 91.5 | 24 |
| Frederik.Andersen | 3298.3 | 92.17 | 30 | 91.47 | 25 |
| Brian.Elliott | 2047.9 | 92.23 | 28 | 91.47 | 26 |
| Michael.Hutchinson | 1690.5 | 92.27 | 26 | 91.42 | 27 |
| Jonas.Hiller | 2591.9 | 92.73 | 14 | 91.38 | 28 |
| Jake.Allen | 1926.9 | 92.34 | 25 | 91.31 | 29 |
| Karri.Ramo | 1684.3 | 92.42 | 22 | 91.31 | 30 |
| Antti.Niemi | 2899.2 | 92.18 | 29 | 91.22 | 31 |
| James.Reimer | 1400.2 | 91.86 | 33 | 91.17 | 32 |
| Curtis.McElhinney | 1345.5 | 91.26 | 42 | 91.13 | 33 |
| Ryan.Miller | 2156.1 | 91.52 | 37 | 91.06 | 34 |
| Kari.Lehtonen | 2884.7 | 91.66 | 36 | 91.01 | 35 |
| Mike.Smith | 2843.1 | 91.43 | 39 | 90.84 | 36 |
| Jimmy.Howard | 2305.9 | 92.06 | 31 | 90.84 | 37 |
| Anton.Khudobin | 1577.5 | 91.22 | 43 | 90.82 | 38 |
| Cam.Ward | 2474.2 | 91.33 | 41 | 90.71 | 39 |
| Alex.Stalock | 1006.3 | 91.78 | 35 | 90.45 | 40 |
| Jhonas.Enroth | 2302.4 | 91.79 | 34 | 90.41 | 41 |
| Anders.Lindback | 1140.5 | 91.01 | 44 | 90.21 | 42 |
| John.Gibson | 1088.8 | 91.34 | 40 | 90.18 | 43 |
| Robin.Lehner | 1144.1 | 90.68 | 45 | 89.85 | 44 |
| Ray.Emery | 1221.1 | 91.43 | 38 | 89.52 | 45 |
| Ben.Scrivens | 2650.4 | 90.28 | 46 | 89.43 | 46 |
| Darcy.Kuemper | 1252.3 | 90.27 | 47 | 89.38 | 47 |
| Viktor.Fasth | 1079.9 | 89.74 | 48 | 89.25 | 48 |
Most of the goalies haven’t moved very far, but it’s also interesting to note that the curve has flattened. The goalies with the worst stats have seen them improve, and those with the best stats have seen them come down to earth somewhat. This is definitely an argument in favour of making sure you have substantial data before reaching conclusions about goalie ability.
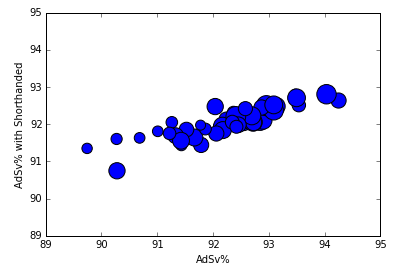 Existing AdSv% compared to including shorthanded shots
Andrew Hammond is the new king of the castle, by virtue of excellent performance from pretty much all shot zones across both 5v5 and shorthanded. One surprising movement is the fall of Henrik Lundqvist. This might be an argument about the Rangers’ penalty killing, but it’s also worth noting that he greatly underperformed his backup, Cam Talbot, on medium difficulty shorthanded shots. Meanwhile, although Craig Anderson approaches Hammond’s excellent numbers, Robin Lehner does not.
| Name | 5v5 Sv%L | 5v5 Sv%M | 5v5 Sv%H | SH Sv%L | SH Sv%M | SH Sv%H |
|---|---|---|---|---|---|---|
| Andrew.Hammond | 97.65 | 92.07 | 87.84 | 96.3 | 88.46 | 91.18 |
| Craig.Anderson | 97.38 | 95.16 | 85.46 | 94.59 | 90.38 | 74.36 |
| Robin.Lehner | 95.61 | 90.57 | 82.5 | 87.5 | 92.31 | 75.86 |
| Henrik.Lundqvist | 97.92 | 93.49 | 83.85 | 92.37 | 81.36 | 74.55 |
| Cam.Talbot | 96.68 | 94.03 | 86.17 | 92.31 | 95.45 | 69.57 |
Good for Hammond, I can see why Ottawa was eager to keep him around!
Why stop there? Extending the method to include all shots
Hopefully I’ve made a good case that we can incorporate the vast number of shorthanded shots into our analysis. Now I’m going to go completely off the rails until nobody agrees with me anymore.
 Because I like to argue with everyone
Image from Adam Arroyo used under licence CC BY-NC-ND
Remember the chart from earlier, with the shot distributions? Notice how the other categories were a lot smaller? That’s going to be a bit tougher to include in the same way. Almost all of the goalies are going to have limited shot numbers in many categories. I could aggregate them into one group, which might work as long as we still account for shot location. However, I can do something a little more interesting.
 More interesting, but not necessarily better
I’m going to do almost the same method, but with an adjustment to handle the small sample sizes in a lot of the categories.
Applying some Bayesian statistics
This is going to be very short, because I don’t want to lose what remains of whatever audience I have. The people who would be interested might already know more about this than I do, and I’ve made the source code available and will share references below. However, the core concept is simple – simple enough for me to not be too intimidated to use it.
What’s the problem with taking the data we see as is, accepting it as the truth for the relative shot-stopping propensity of the goalies? The problem is we won’t always believe it, and for good reason. There is so much randomness. If a goalie faces 5 shots and stops them all, do we really expect he will stop 100% from that location-situation? The same goalie could have let one in, and now do we think he is a 80% stopper? We have seen a lot of goalies over the years, and by the time they get into the NHL most these days are around the 85-95% range, depending on what type of situation we’re looking at. In this example, regardless of how good the goalie is he can’t fall in that range. We’re either going to underrate or overrate him, depending on his luck.
So we have good reason to expect much of the variance in the data comes from randomness, and that most of the goalies hover around the same range within a location-situation. In Bayesian stats what we do is make that belief explicit. We can actually say we expect a goalie to have a certain save percentage, and we can specify the distribution around that. We need a distribution because some goalies will be better and some worse and because there will be random variation in the percentages from goalies of the same talent. This expectation is called a prior. We start with our prior, and then we perform updating will all of the data we have to reach an outcome estimate, called a posterior. The more data we have, the less we rely on the prior. The more different our data is from the prior, the more we change our estimate.
This type of problem, where we sample from binary data (and thus a binomial distribution) fits nicely into this framework by using a beta distribution as a conjugate prior. I won’t go into a ton of detail here, but I’ll link you to a nice reference (PDF) or two (PDF). For my priors I assume the league average save percentage in a location-situation, essentially weighted by how many shots were faced on average. There are limitations with this.
- This is somewhat arbitrary and I am not grounding that strategy in any empirics
- The goalies with less shots are likely to be below average (since they’ve been given less playing time)
- Something a lot neater would be to build a model to predict my prior, such as by including past data or an age curve. This would get us into hierarchical Bayesian models
Conclusions
So when I do that with 5v5, 4v4, shorthanded, and powerplay shots, how does it work?
Pretty well, I think! It totally depends on how much weight we give to the prior. By putting a relatively high weight on the prior I’m limiting the effect of other categories plus muting the resulting actual number, which probably should not be taken literally unless the prior was more intelligently grounded.
The stats update a little bit, but not nearly as much as adding shorthanded shots. This makes sense, since shorthanded shots are much more common and will have more weight. For simplicity we could just use 5v5 and shorthanded shots.
| Name | TOI | AdSv% | Rank | Bayes Sv% | Rank |
|---|---|---|---|---|---|
| Carey.Price | 3777.9 | 94.03 | 2 | 92.81 | 1 |
| Andrew.Hammond | 1205.6 | 93.48 | 5 | 92.8 | 2 |
| Cory.Schneider | 3163.4 | 93.5 | 4 | 92.71 | 3 |
| Steve.Mason | 2296.4 | 94.25 | 1 | 92.64 | 4 |
| Marc-Andre.Fleury | 3186.1 | 93.09 | 9 | 92.52 | 5 |
| Craig.Anderson | 1796.7 | 93.54 | 3 | 92.51 | 6 |
| Braden.Holtby | 4048 | 92.96 | 10 | 92.5 | 7 |
| Devan.Dubnyk | 3190.4 | 93.13 | 6 | 92.48 | 8 |
| Semyon.Varlamov | 2648.5 | 92.04 | 32 | 92.47 | 9 |
| Ondrej.Pavelec | 2335.3 | 92.87 | 12 | 92.45 | 10 |
Carey Price moves to the top, essentially tied with Andrew Hammond. Their relative rank changes depending on which prior we set. Either way, having them at the top fits with the eye test from all of us watching last year. And our buddy Steve Mason? He might not be dominating the rankings anymore, but his season was still respectably top 5. Not a lot of Flyers can say that!
I’m glad that the conference spawned some ideas for me. If this has done the same for you, please e-mail me and let me know - I’m happy to field any thoughts, contributions, questions, or utterly vicious criticism.