Header image is D700 noise tests by Carl Jones used under license CC BY-NC
Last weekend I ventured up to Vancouver for the 2017 Vancouver Hockey Analytics Conference (VanHAC), where I gave a presentation titled Small Sample Methods for Goaltender Evaluation. There were quite a set of really intriguing talks (check out this nice summary), and I encourage you to go through them all.

And you don’t get a lot of chances to hang out in an empty arena!
The core problem
My talk centres around the topic of how to evaluate goaltenders, and in particular describes a few methods that I think are relevant.
There are two primary challenges we face when judging goalies:
- The number of goals, especially as we try to account for confounding factors, is relatively small
- We have trouble isolating goalie performance from team effects
A metric for metrics
Despite those problems, we would like to have at least some quantitative metric to judge goalies by. How do we compare different metrics against each other? If we looked for the metric with the highest correlation with wins, our chosen metric would probably be…wins. If we looked for the metric with the highest predictive power for future wins, our chosen metric would probably be…wins, still. We have this problem where we don’t have a ground truth outcome for goalie performance (and if we did, we’d probably use that for our comparisons).
My approach is to evaluate using year-over-year consistency in the ordering of goalies. The basis for this concept is the hope that:
- The true (unobserved) rank of goalies has at least some consistency across years
- Metrics that have high year-over-year consistency will do so because they measure goalie quality
The second point is not always true – for example, wins will have high correlation with itself. So I try to identify metrics that have high correlation but low confounding team effects.
To measure this year-over-year consistency, I use Spearman correlation. This isn’t Pearson correlation, which is the linear correlation that is more commonly used. Instead this is the rank-order correlation. Rank all of the goalies in one year by your metric of choice, then rank them in the next year. If the two ranks are the same, you have Spearman correlation of 1. If they’re the exact opposite, the Spearman correlation is -1. Anything else and it will be somewhere in between.
Using Spearman correlation like this has three really nice properties:
- It’s directly about ranks. We often do care about the ranks of goalies, such as when we choose which one to play or which one to sign in the off-season.
- This metric is resilient to outliers, while Pearson correlation is not. Spearman correlation only depends on rank, and not the absolute values (although those are still useful because we do care about accuracy).
- The composition of teams changes across years, and some of the goalies move teams too. This change is actually good: if we want to measure which goalies are the best, invariant of which team they are on, we want a metric that gives us the same order regardless of team changes.
Applicable methods
Confidence intervals (CIs) are pretty dry material. But they serve a purpose. They help me avoid memorizing randomness.
When we analyze a graph or a statistic without any investigation on how sensitive it is to random variation, we do ourselves a disservice. The best statistics make arguments about the world. Sometimes our conclusions could be entirely different if one or two events had gone a different way. I would rather be unsure about something than confident and wrong.
So with that in mind, I showed 95% confidence intervals around single-season 5v5 HD save percentages, to demonstrate how we can’t have much confidence in any conclusions we reach from them. Almost all of the most played goalies have overlapping CIs – and the goalies who played less will have even wider ones.
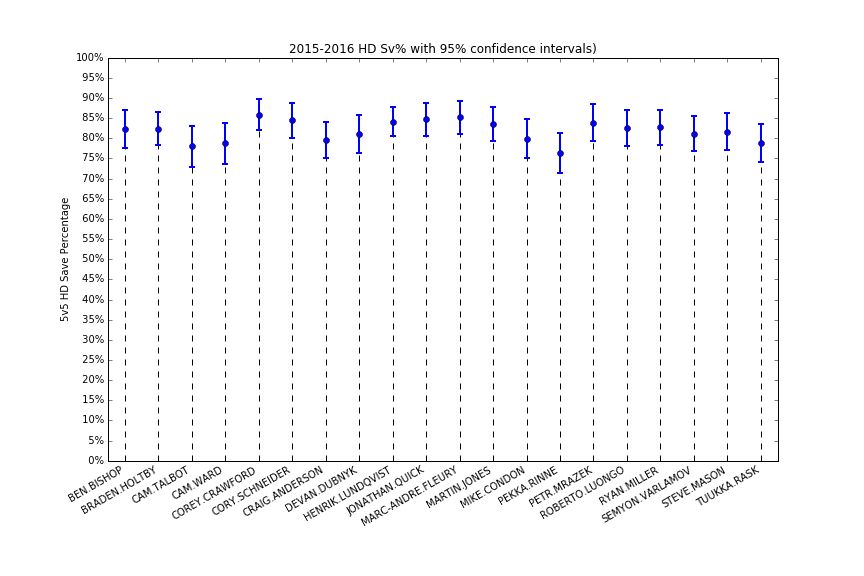
It’s like a whole bunch of starters, and Mike Condon
I also described the process behind bootstrapped confidence intervals, which are very helpful for many statistics that do not have well-established properties. I kept this part short, to not scare away half my audience.
The other B-word that might send a hockey audience rushing to the exit is Bayesian. Bayesian smoothing is a practical method for making sensible rate statistics despite small samples. If a goalie has faced a lot of shots, the smoothing will have little impact to their statistic. But if a goalie has faced few shots, we’ll expect them to be close to our prior (which could be league average, or based on their results from a previous league, for example). Anywhere in between and the statistic will be a blend of the two.
An approach to differing sample sizes among goalies is to create conditional statistics. For playoff evaluation, rather than asking “Which goalie put up the best numbers?” I ask “Which goalie had the most extreme numbers conditional on the time they played?” You can see more on that method in an earlier post
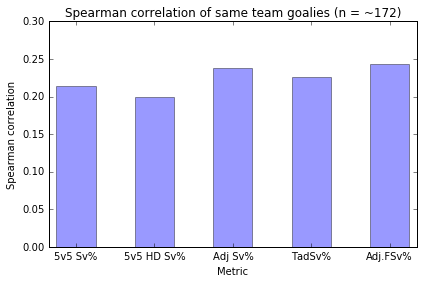
The way I look at team effects is to compare pairs of goalies that play for the same team. Differences in performance should be attributable to the goalies (mostly – the teams may play differently in front of them, or the coaches may optimize goalie selection in a way that results in unbalanced stats). For example, if we were to compare adjusted save percentage (Adj Sv%) versus twice adjusted save percentage (TadSv%), TadSv% looks strictly better in this sample. It has better rank-order correlation for sets of high volume goalies as well as across all goalies, and it also has a lower correlation between goalies on the same team. Likewise 5v5 HD save percentage (5v5 HD Sv%) looks strictly better than 5v5 Sv%.
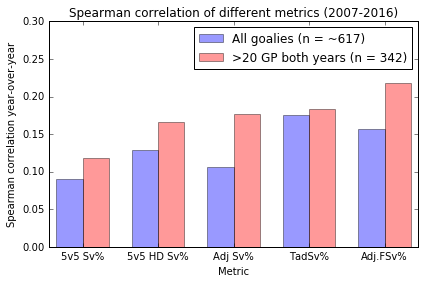
Higher is better
Higher is not better
But note, however, that every metric there has a large positive correlation between goalies on the same team. Wouldn’t we expect (true) goalie talent to have a negative correlation, since the teams with the best goalies have less need for top backups? It might not be that simple; maybe some teams are better at evaluating goalies than others, so they end up with two good ones. However I think the large correlation is worrisome, and suggests to me that all of these metrics are still capturing significant team effects.
Future work
I covered a lot more in the talk, so do take time to browse the slides, and feel free to let me know if you have any questions or counterpoints.
I’m not sure when I’ll get back to looking at goalies. I have a few ideas, but they’re all incremental rather than revolutionary. I’m worried that everything is a half-measure until we have player tracking data and can better estimate team effects. In the meantime I have a handful of project ideas, inspired in no small part by the talks I saw in Vancouver.