Header image is Loving Nature, Loving Each Other… by Peter Kurdulija used under license CC BY-NC-ND
All this talk about the NHL’s Greatest 100 got me thinking about what goes into hockey greatness. I always lamented how there wasn’t a Hockey Hall of Fame model like basketball-reference’s model. So I thought I would go about predicting both things. I chose the HHoF first, for secret reasons to be revealed later.
 Just try to tell me you aren’t intrigued by secrets.
Secret from Wassim LOUMI used under licence CC BY-SA
Approaching the model
I approached this a lot like anything else: define hypotheses, gather data, explore the data, build models, and evaluate out-of-time (in this case, on players who are not yet eligible). Not surprisingly, I did it all in Python, pulling all player data for every NHL player ever, and used cacheblob to manage the data. Going into this, knowing I had limited data, I wanted to be hypothesis driven. I believe that both these lists are not specifically about quality of play, but instead greatness. Greatness, or glory, is made up of being a top player, playing well for a long time, winning at the highest levels (Stanley Cups and Olympics), captaincy and other leadership, winning major awards, and inspiring nostalgia. Scoring the biggest goals and making the key plays when they’re needed can all add to a player’s aura, but I won’t be able to capture much of that in the metrics I have.
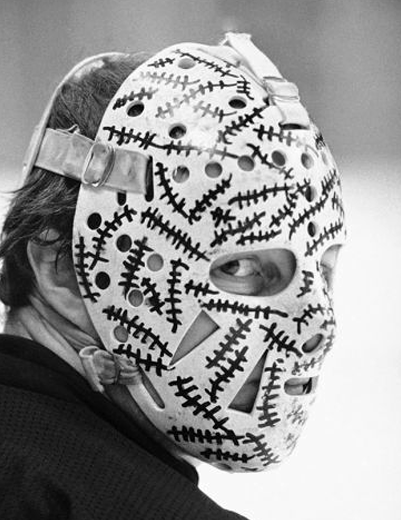 But I’m definitely putting in a variable for wicked goalie mask.
I wanted models that would generalize, in a number of ways. So unlike Basketball Reference, which is specifically trying to have predictive accuracy on upcoming candidates, I wanted to find out how we define greatness in hockey. This is one of the only ways in which we (implicitly) make cross-generation comparisons in hockey, so I wanted to capture the whole time frame of the NHL. Which means there’s a lot of great data I can’t use because they weren’t recorded (hits? blocks?) or didn’t exist yet (many of the trophies, including the Norris).
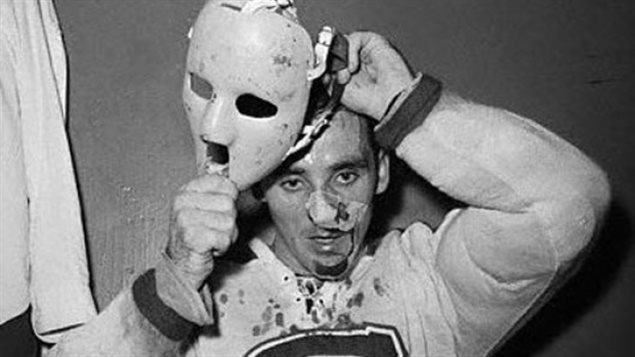 Unfortunately the wicked goalie mask variable isn’t populated until this moment in 1959.
Choosing data is also about choosing limitations. I’m using data from hockey-reference.com about NHL performance. This means my models will be relatively blind to the contributions of pre-NHL hockey pioneers, excellence in leagues such as the WHA or WCHL, elite international players like the Red Army teams, and standout players in women’s leagues. This is not me defining glory as NHL glory, but rather me accepting the limitations of my data and choosing to only model glory that can be attributed to NHL performance. Further, to get at least a few trophies into the mix, I lose a few early NHL years, limiting my sample to players who started in 1930 or later.
Historical and time-varying effects
It’s harder to make the hall than it has ever been. Edgar Laprade was a centre who played from 1945 to 1955, never won a cup, was never an All Star, and retired with 280 points. He’s in the Hall of Fame. Mark Recchi played for over 20 years, won 3 cups, was an All Star, and retired with 1533 points. He’s still waiting for his call. In all fairness, with Recchi that might be a time horizon problem: I’m now more confident that he’ll be recognized, if not immediately then in some future generation. Entries are capped at four (players) per year, so some players wait longer than others. However, he’s not the only notable player from recent years who has been kept out: others including Dave Andreychuk, Curtis Joseph, Jeremy Roenick, Pierre Turgeon, Keith Tkachuk, Theoren Fleury, Alexander Mogilny, and Paul Kariya demonstrate that the stars of the 90’s have not been looked upon kindly by the hall.
Along with the criteria seeming to become harder and harder, there are also a host of players who played in the early days of the NHL, and played a lot in other leagues too. It’s the Hockey Hall of Fame, not the NHL Hall of Fame.
We can fit this better if we treat glory as having a fixed quantity in any period of literal time. It doesn’t matter that seasons were as short as 18 games once upon a time (1918) – the best players in that period were still the best players, held on an equal footing with players in 82 game seasons now. Likewise it doesn’t matter if modern players are (likely) much better at the actual game of hockey – prior elite players were still elite for their era. With this framework, I adjust some features (like point totals) for average offensive output and for the length of season. I also create a factor for the number of teams in the league. When there were 6 teams in the league (from 1942-43 to 1966-67, and some sporadic years before that) it was easier to be the league’s best player or best goalie or get the most points. For the last 15 years there have been 30 teams, so being one of the best in the league is harder than ever. We don’t elect five times as many players per year as we used to.
This feature is beautiful, because it fits the data, fits our intuitive understanding of the selection process, and can generalize to future eras. Rather than including a quadratic term that would imply future players could never reach the HHoF, using teams in the league suggests that the near-future will be approximately as difficult as the recent past has been.
The model
The model works pretty well, but I’ll spare you a slew of charts and limit myself to just one.
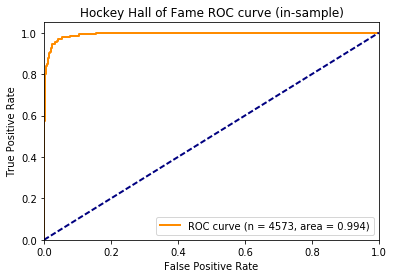
That’s one fine lookin’ ROC curve you got there.
So what do we end up with? The coefficients are for a logistic model (so non-linear with respect to probability), but we can intuitively measure them relative to each other. Below I’ll describe the effects of a few notable variables.
- Each goal-adjusted season-length-adjusted point is worth about 1% of a cup.
- Each season-length-adjusted goalie win is worth about 1/14th of a cup.
- Each incremental team in the league costs nearly half a cup.
- Being a 1st or 2nd team All Star is worth about 1 cup.
- Winning the Hart trophy is worth nearly 3 cups.
Top players of all time
You want probabilities? You got em! Right here.
The top predictions are a who’s-who of the greatest players of all time. Gordie Howe, Wayne Gretzky, Maurice Richard, Howie Morenz, and Phil Esposito fill out our top five, with a host of other elite players only ever-so-slight decimal places away. The first 60 listed are all in the Hall of Fame, with Mark Recchi (98.9% likely) being the first exception – one that I expect will be rectified at some point. For context, he falls right behind Ken Dryden, Chris Chelios, and Ron Francis, but right ahead of Jari Kurri, Larry Murphy, and Andy Bathgate.
| Rank | Name | Final season | Prediction |
|---|---|---|---|
| 1 | Gordie Howe | 1979-80 | 1 |
| 2 | Wayne Gretzky | 1998-99 | 1 |
| 3 | Maurice Richard | 1959-60 | 1 |
| 4 | Howie Morenz | 1936-37 | 1 |
| 5 | Phil Esposito | 1980-81 | 1 |
| 6 | Bobby Hull | 1979-80 | 0.999999 |
| 7 | Jean Beliveau | 1970-71 | 0.999998 |
| 8 | Nels Stewart | 1939-40 | 0.999997 |
| 9 | Jacques Plante | 1972-73 | 0.999996 |
| 10 | Cy Denneny | 1928-29 | 0.999996 |
Claude Provost (88%) strikes me as another interesting omission. He won the cup 9 times, was an All Star, played mostly in the Original Six era, ended up with 589 points, and is highly regarded by Point Shares. Sure, he was never the best player on any of those Montreal teams, but those teams were some of the best ever, stacked with names like Maurice Richard, Bernie “Boom Boom” Geoffrion, Jean Beliveau, Yvan Cournoyer, Henri Richard, Dickie Moore, and Jacques Plante, among other Hall of Famers. Provost is probably rewarded a little too much by the model for his 9 cups.
At the other end of the spectrum, many of the players missed by the model played in the early years of the league. Others had international careers – former Red Army teammates Sergei Makarov (0.2%), Viacheslav Fetisov (0.5%), and Igor Larionov (2%) all fall in the bottom 10 least likely Hall of Famers. They were all exceptional and fully deserving, especially given that they found success in two leagues and international play.
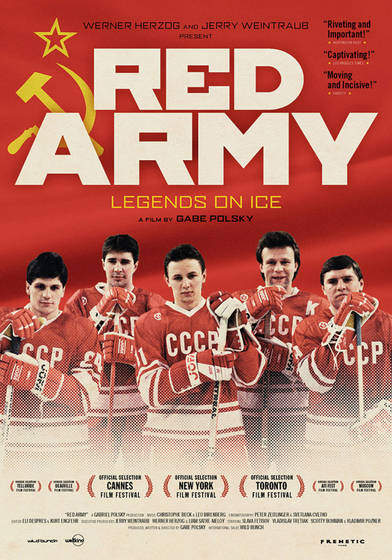
Three of these guys are in the Hall of Fame. And if you haven’t seen this movie yet, you really should.
Bob Gainey (0.9%) is the bottom modern NHL inductee, followed by players like Clark Gilles (5%), Gerry Cheevers (9.3%, but he had a wicked mask), and Bernie Federko (17%). I don’t have Selke or Smythe trophies in the model because they haven’t been around long enough, so Gainey doesn’t benefit from that. Tell me how Federko, with 0 cups, 0 awards, 0 All Star berths, and point totals padded during the highest scoring NHL era, deserves recognition over Claude Provost or Mark Recchi. Or how Gainey, as a low-scoring forward in a high-scoring era on elite Montreal teams deserves it more too.
However, overall the list seems very sensible. Most of the misses are reasonable, due to data limitations (other leagues, Selke trophies, my strict avoidance of overfit, etc). The data fits very well overall, so I’m happy with that.
Top active/recent players
Here’s our first look at generalization (and only a light one at that, given that I could review this during the model build).
| Rank | Name | Prediction |
|---|---|---|
| 1 | Martin Brodeur | 0.999972 |
| 2 | Jaromir Jagr | 0.999969 |
| 3 | Alex Ovechkin | 0.999914 |
| 4 | Teemu Selanne | 0.999825 |
| 5 | Jarome Iginla | 0.996266 |
| 6 | Joe Thornton | 0.987018 |
| 7 | Sidney Crosby | 0.980949 |
| 8 | Marian Hossa | 0.949295 |
| 9 | Daniel Alfredsson | 0.901087 |
| 10 | Martin St. Louis | 0.858036 |
| 11 | Patrik Elias | 0.792101 |
| 12 | Sergei Gonchar | 0.72879 |
| 13 | Vincent Lecavalier | 0.671983 |
| 14 | Patrick Marleau | 0.666455 |
| 15 | Evgeni Malkin | 0.634124 |
| 16 | Henrik Sedin | 0.607218 |
| 17 | Zdeno Chara | 0.542186 |
| 18 | Daniel Sedin | 0.537432 |
| 19 | Patrick Kane | 0.528047 |
| 20 | Pavel Datsyuk | 0.525584 |
| 21 | Rick Nash | 0.487784 |
| 22 | Corey Perry | 0.480322 |
| 23 | Ray Whitney | 0.454004 |
| 24 | Roberto Luongo | 0.447119 |
| 25 | Marian Gaborik | 0.303105 |
| 26 | Steven Stamkos | 0.28948 |
| 27 | Henrik Zetterberg | 0.261349 |
| 28 | Eric Staal | 0.245347 |
| 29 | Henrik Lundqvist | 0.236532 |
| 30 | Marc-Andre Fleury | 0.217245 |
| 31 | Dany Heatley | 0.21469 |
| 32 | Shane Doan | 0.195344 |
| 33 | Jason Spezza | 0.185594 |
| 34 | Brad Richards | 0.176949 |
| 35 | Ryan Getzlaf | 0.173432 |
| 36 | Alex Tanguay | 0.152443 |
| 37 | Duncan Keith | 0.143237 |
| 38 | Dan Boyle | 0.134238 |
| 39 | Kimmo Timonen | 0.132411 |
| 40 | Nikolai Khabibulin | 0.113013 |
The top are all sure-fire Hall of Famers, including Martin Brodeur, Jaromir Jagr, and Alex Ovechkin. Jarome Iginla has never won a cup, but he’s played forever, led the league in goals and points, and been an All Star 4 times. Looking further down the list, I’m sure some of these players won’t make it, but I don’t know which ones. Patrik Elias seems unlikely to me even with his 79% odds, and Sergei Gonchar is already waiting despite 73%. Others, like Evgeni Malkin at 63% and Pavel Datsyuk at 53%, seem too low. Duncan Keith is surely in, despite a 14% score. The model doesn’t know about his Norris and Smythe wins, or Olympic golds.
Goalies
Goalies deserve their own section, not only because of how hard they are to model, but how weird they are.
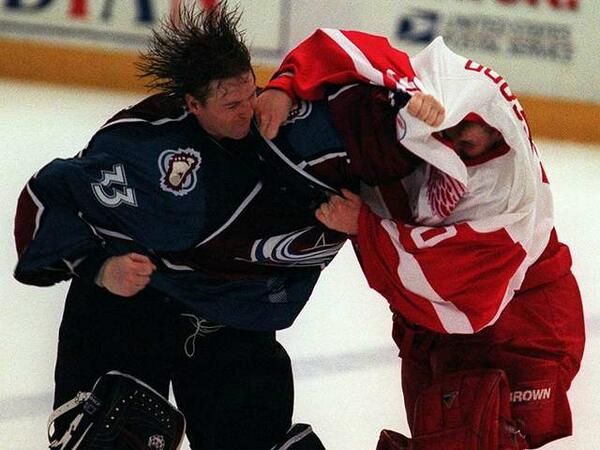
I mean, just look at those haircuts.
For starters, there aren’t any. Only 29 NHL goalies have made the Hall of Fame. That’s not a lot to get through. It means we have the simultaneous problems of having low confidence effects while being able to overfit easily.
Worse, goalie performance (at least to the extent we can measure it) is highly variable. While a Hart trophy guarantees Hall of Fame status for a skater (except for Tommy Anderson, who won it in the talent-deprived WWII years), it doesn’t for goalies (ask Al Rollins or Jose Theodore). Let alone a Vezina: as many goalies have won that without making the hall as those who have. Don’t believe me? Ask yourself what Pete Peeters, Tom Barrasso, Pelle Lindbergh, John Vanbiesbrouck, and Ron Hextall and have in common. Not only did they all win Vezina trophies without making it into the Hall of Fame, they did it in five consecutive years. Oh, and for a while before that we used to award the trophy to both goalies on the team, and used to award it purely on least goals.
We don’t have great historical metrics to compare goalies. Not that our current metrics are perfect either. We’re going to have to rely heavily on wins and shutouts.
Still, our model worked out pretty well.
| Rank | Name | Final season | Prediction |
|---|---|---|---|
| 1 | Jacques Plante | 1972-73 | 0.999996 |
| 2 | Terry Sawchuk | 1969-70 | 0.999987 |
| 3 | Martin Brodeur | 2014-15 | 0.999972 |
| 4 | Turk Broda | 1951-52 | 0.999618 |
| 5 | Clint Benedict | 1929-30 | 0.999551 |
| 6 | George Hainsworth | 1936-37 | 0.999393 |
| 7 | Patrick Roy | 2002-03 | 0.999379 |
| 8 | Glenn Hall | 1970-71 | 0.999293 |
| 9 | Tiny Thompson | 1939-40 | 0.998986 |
| 10 | Dominik Hasek | 2007-08 | 0.994054 |
Almost all the goalies in the HHoF are classified correctly. We do see some weird cases. Lorne Chabot (97.9%) and John Ross Roach (97.7%) were two early great goalies, both winning over 200 regular season games and cups, but not in the hall. Compare that to Roy Worters (89.5%), from the same period, who won fewer, ended his career with a losing record, and never won a cup. Worters did win a Hart, but it’s not at all clear otherwise how to identify him as a more worthwhile entry than Chabot or Roach.
I feel like Curtis Joseph (25%) is underrated. In general, but also by these numbers. It’s tough to be high up the list without a Vezina or a cup or even an All Star berth. Tough era, peaking alongside Martin Brodeur and Dominik Hasek. Roberto Luongo seems undervalued at only 45%, but then again, he hasn’t won a Vezina or a cup. It’s more clear to me now how I could adjust the inputs to better capture goalie glory, but out of principle I’m not doing it, because then I’m really fitting on my out-of-time validation.
Summary
Don’t think I’m done yet! I have much more to say, and this has become far too long. More to come! In the meantime, have fun digging through the probabilities.