Header image is D700 noise tests by Carl Jones used under license CC BY-NC
Something came up the other day that distracted me from an upcoming piece (stay tuned: it’s better, I promise!), and sent me on this little investigation. For anyone hoping that this post has some connection with the Rihanna song, let me just send you to the Youtube link now and we can avoid some impending disappointment.
Comparing NHL goalies, evermore
There’s a little corner of the sports stats world reserved for those who are nutty enough to try to improve goalie stats. The standard ways of looking at goalies, such as how many goals they give up per game or what percentage of shots they save, are very limited and will give a poor impression of goalie quality. The data is limited and has high variance, but bit by bit we are making it better.
I quite like the WAR on Ice method of adjusting for shot location on the ice. One current point of contention is how to incorporate shorthanded scenarios into our analysis. While most of a hockey game is played at full strength (5-on-5), the second largest situation for shots faced is 5-on-4, when the other team has a man advantage.
Recently Nick Mercadante, author of one of the articles linked above (and who explained the method excellently and colourfully at the 2015 RIT Hockey Analytics Conference - slides here), described his stance as to why he looks exclusively at 5-on-5 stats.
Why don't I do PK Mercad? No correlation between 5v5 and PK performance. Tells me PK is more team and/or opp driven. pic.twitter.com/QLoqqHQEHJ
— Nick Mercadante (@NMercad) May 4, 2016
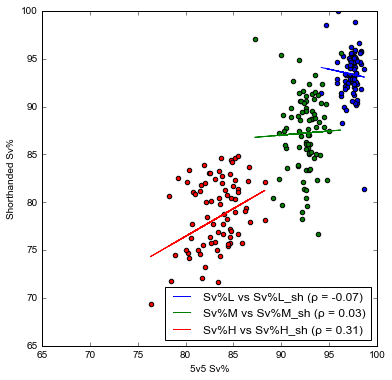
What he’s showing there is that how well goalies perform 5-on-5 is not highly correlated with how well they perform shorthanded. He’s right on this (not that I’d doubt it, but I was able to replicate the general result).
Yet, that doesn’t end the debate. If anything, it’s a starting point.
Anyone interested in following along in code can find it in this repository.
What this could mean
The hypothesis that a goalie’s stats shorthanded are more strongly determined by how their team plays (or the other teams play) when a man down, rather than intrinsic goaltender ability, is entirely reasonable. This implies that there are team effects beyond just where the shooter can shoot from, since we can already adjust for that. The quality of shots within any location could depend more on team penalty defence. However, I feel there is room for alternative hypotheses.
- This implicitly assumes that the team effect is ruining our shorthanded stats and not the 5-on-5 stats, when it could possibly be the other way around.
- What if these are just different talents? Although we could expect that a better goalie will perform better across most categories, this isn’t necessary true. We could have low correlation because the skills have low correlation, when we’re only looking at the world’s best goalies.
Could goalie talent differ across scenarios and locations?
Yes, it could. This reminds me of some models in economics where we see compensation in secondary factors counteracting variation in primary factors.
Here’s a possible model of how that could work in hockey:
- The goalies in the NHL are the best of the best. They have been filtered down at every level. We’re looking at the elite tail of the distribution.
- If a goalie was distinctly worse across all scenarios, then he would exit the league and be replaced. He wouldn’t be in the skill tail that we’re looking at. Nobody can be truly bad for a long time.
- The goalies who have the worst 5-on-5 stats could have above average shorthanded stats, partially compensating.
- In practice this would be tempered by the time it takes to discover how bad a goalie is. But nobody should be a bad starter forever.
I don’t entirely believe that this is how it works. There aren’t infinite potential goalies to choose from, so we can still have drastic differences in quality before getting to replacement level. But I acknowledge that this is possible.
Let’s look at some pretty pictures. In all of these ρ, the Greek letter rho, is the Pearson correlation coefficient.
 Oh the lovely colours!
Here I’m looking at approximately the same sample (the last three seasons), and breaking down the comparison into shot locations. We can see that while the low quality and medium quality correlations are not statistically significant, the high quality correlation is. Take that as you will.
Let’s compare goalie performance across the difficulty levels.
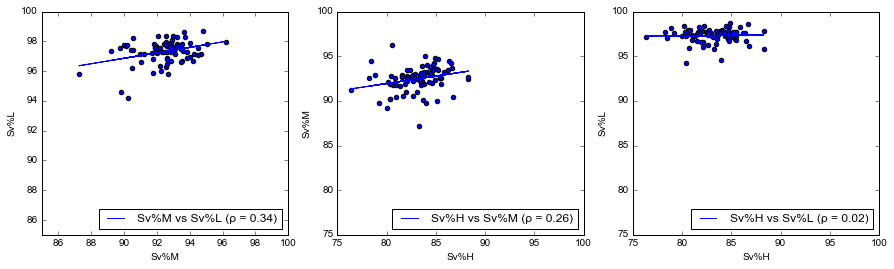 Looking at just the 5-on-5 stats here
Note that while the correlation between low and medium are strong, and between medium and high as well, low and high do not have a significant correlation. Maybe low is more noisy (especially given the high save percentage), or maybe the skills are somewhat separate.
These diagrams suggest to me that we shouldn’t always expect correlation goalie measures that are based on entirely exclusive data. There is a lack of correlation of observed performance across locations and situations. In this case, absence of correlation should not be evidence in favour of disavowing information.
Testing the team effect
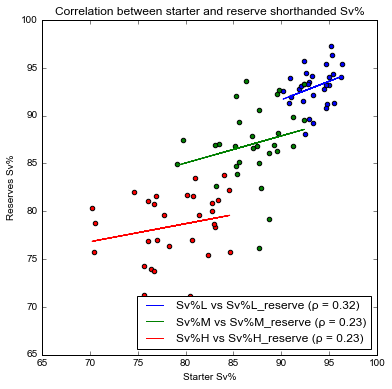
I have a simple method for testing whether shorthanded stats are more contaminated by team effects than full strength stats. It’s to use the other goaltenders on the same team as a point of comparison. We can see whether correlation between the starters’ stats and their backups’ are more similar in shorthanded situations than in full strength situations.
In this first chart, I lay out the shorthanded correlations between the goalie who played the most minutes for that team across the three year period, and all of the other goalies on the same team. We can see that there actually is quite a large correlation. The team effect is real.
 There’s a noticeable relationship in every category
Now brace yourselves for the shocking twist.
 I see correlations. Some of them scare me.
Ready? The team effect exists in full strength play too!
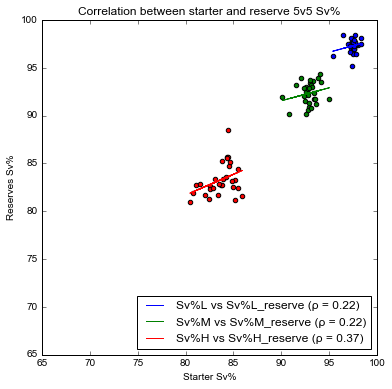 There’s a noticeable relationship in every category
Not only are there correlations everywhere (just like dead people?), but that the correlations in shorthanded play are not everywhere stronger than in full strength play. If team effects are a problem (and I am now much more convinced of this) then they are a problem in full strength scenarios too.
There are many reasons why this could happen, not the least of which is that our shot location metric is quite limited by being split into only three regions. Imagine what we could do with accessible player tracking data.
Conclusions
At the start I posed the question: Should we consider shorthanded stats when evaluating goalies?
My answer now, is yes. It was yes before, and it is still yes. I’m not convinced we have bigger problems with shorthanded data than with full strength data, aside from having less of it. I always try to use all the data.
However, now I am much more worried about team effects across any goalie metrics. Separating out team effects could be a very fruitful area of future research. We might be able to borrow some ideas about the NFL, where quarterback performance has the same issue.
This research has led to more questions than answers for me. It’ll be fun trying to hunt them down.