Here we go! I realize that I’m a day late, but I’m not cheating. I made sure to get the tables on github last night, so you can, like, totally [verify][github] that. It’s almost like the season starts earlier every year.
Let’s take a second to appreciate how great of a season and playoffs that was for the Raptors. Bold trade before the season, bold trade during the season, coaching change, incredible discipline on managing rest for the players…and then all of that leading to the second best record in the regular season and an NBA championship. First getting through a stingy Orlando team, then an epic 7-game battle versus a true contender in Philly, then to come back from a 2-0 deficit versus the Bucks, the league’s top seeded team, and then finally to come out on top over an incredibly resilient Warriors team.
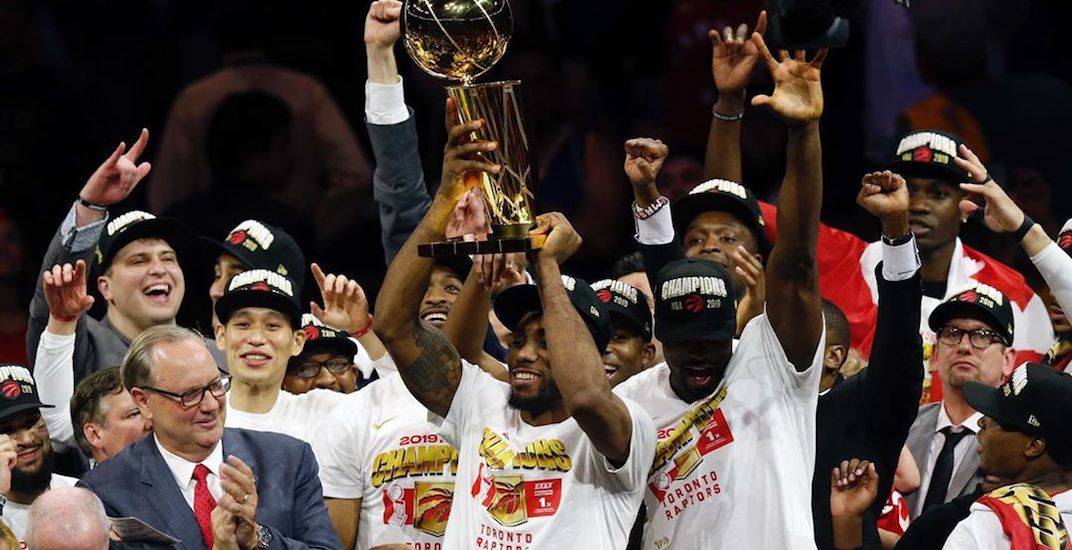 Way to get that Larry O.B.!
Citation: NBA Canada/Instagram
But I’m not here to gloat. Or at least, not about the Raptors. I’m here to gloat about my predictions.
Playoff probabilities
The model was built to calculate playoff probabilities at the start of the season, and for this it did very well. It cleanly beat 538 by log loss or MSE. There aren’t many other sources that predict playoff probabilities rather than win totals. We can see Alec Nathan at Bleacher Report, for example, who has a log loss of infinity for giving Orlando a 0% chance of making the playoffs. Probabilities are hard.
We can see how hard probabilities are by looking at 538’s predictions (set it to October 15). They had Washington at a 92% chance of making the playoffs, the Lakers at 84%, Orlando only at 19%, and the Clippers at only 12%. My model didn’t get those outcomes right either, but it was less wrong: it had Washington at 65%, the Lakers at 58%, Orlando at 25%, and the Clippers at 28%. This is not a coincidence: my model in general is less confident, so when it is wrong it is less wrong.
Eastern Conference
| Team | Pred. Wins | Wins | Delta | P(Playoffs) | Made Playoffs |
|---|---|---|---|---|---|
| Toronto Raptors | 57.6 | 58 | 0.4 | 99% | Yes |
| Philadelphia 76ers | 49.4 | 51 | 1.6 | 88% | Yes |
| Boston Celtics | 48.7 | 49 | 0.3 | 86% | Yes |
| Washington Wizards | 42.4 | 32 | -10.4 | 65% | No |
| Indiana Pacers | 42.2 | 48 | 5.8 | 65% | Yes |
| Milwaukee Bucks | 41.6 | 60 | 18.4 | 63% | Yes |
| Detroit Pistons | 40.8 | 41 | 0.2 | 59% | Yes |
| Miami Heat | 40.6 | 39 | -1.6 | 58% | No |
| Cleveland Cavaliers | 39.4 | 19 | -20.4 | 54% | No |
| Charlotte Hornets | 38.7 | 39 | 0.3 | 50% | No |
| Brooklyn Nets | 37 | 42 | 5 | 42% | Yes |
| Orlando Magic | 31.7 | 42 | 10.3 | 25% | Yes |
| New York Knicks | 28.8 | 17 | -11.8 | 15% | No |
| Atlanta Hawks | 28.5 | 29 | 0.5 | 14% | No |
| Chicago Bulls | 23.9 | 22 | -1.9 | 4% | No |
Western Conference
| Team | Pred. Wins | Wins | Delta | P(Playoffs) | Made Playoffs |
|---|---|---|---|---|---|
| Golden State Warriors | 62.6 | 57 | -5.6 | 98% | Yes |
| Houston Rockets | 55 | 53 | -2 | 90% | Yes |
| Oklahoma City Thunder | 51.4 | 49 | -2.4 | 85% | Yes |
| Utah Jazz | 48.6 | 50 | 1.4 | 77% | Yes |
| Minnesota Timberwolves | 48 | 36 | -12 | 73% | No |
| Denver Nuggets | 47.6 | 54 | 6.4 | 73% | Yes |
| San Antonio Spurs | 44.1 | 48 | 3.9 | 60% | Yes |
| Los Angeles Lakers | 43.8 | 37 | -6.8 | 58% | No |
| Portland Trail Blazers | 41.2 | 53 | 11.8 | 47% | Yes |
| New Orleans Pelicans | 40 | 33 | -7 | 43% | No |
| Dallas Mavericks | 37.4 | 33 | -4.4 | 32% | No |
| Los Angeles Clippers | 36.3 | 48 | 11.7 | 28% | Yes |
| Memphis Grizzlies | 31.5 | 33 | 1.5 | 14% | No |
| Sacramento Kings | 26.2 | 39 | 12.8 | 5% | No |
| Phoenix Suns | 24.9 | 19 | -5.9 | 5% | No |
My model was only super confident about two teams: our eventual NBA finalists, the Toronto Raptors and the Golden State Warriors. It had them at 99% and 98%, respectively. The model can only be super confident when teams don’t have any subpar players, such that no selection of injuries or talent degradation could reasonably prevent the team from making the playoffs. My model had the Spurs slightly above the Lakers (60% versus 58%) for similar reasons. Top talent is king, especially when you the the king, but the rest of the roster matters too. Even the king could play worse or miss a lot of games. Meanwhile the depth of the Spurs paid off for them.
Rankings
We can see that the rank ordering looks pretty good. In the East, my biggest misses were probably Washington at the 4th seed (ended up at 11), Milwaukee at 6th instead of topping the standings, Orlando at 12th instead of 7th, and Cleveland at 9th instead of 14th. I had 6 of the 8 playoff teams.
In the West I had Minnesota at 5th instead of 11th, Blazers as 9th instead of 3rd, Kings at 14th instead of 9th, and Clippers at 12th instead of 8th. I again had 6 of the 8 playoff teams.
Between the two conferences, my biggest positional gap was Washington, with a seven spot gap between prediction and actual. Although notably the predicted wins were very close, with five teams separated by only a two win gap.
Those are the errors, but the rest of the league looks like a big success. The edit distance between my rankings and the actual rankings looks relatively narrow. In the East I got Toronto, Philly, Boston, Indiana, Detroit, Brooklyn, Orlando, Atlanta, and Chicago all in the right order. In the West, Golden State, Houston, Utah, San Antonio, LA Lakers, New Orleans, Dallas, and Phoenix all ordered correctly. Not a lot of people had San Antonio making the playoffs and finishing ahead of the Lakers, but my model did.
Win Predictions
My win predictions did well, but not as good as a lot of other forecasters. While I handily beat 538 by MSE, I finished a bit behind Pinnacle odds, the ESPN summer forecast, and Kevin Pelton, among others. Many of my predictions were very close, including rounding to the right number for Atlanta, Boston, Charlotte, Detroit, and Toronto. But some were far off. The ones that really hurt me in MSE were Cleveland, who won 19 instead of 39 games, and Milwaukee, who won 60 instead of 42 games.
Cleveland is an illustrative example. The model realized that Cleveland had many bad players and they would play a lot of minutes. But it also thought that Kevin Love would be third in minutes and play well. Instead, he had an injury-shortened season and was 12th in minutes. Likewise it expected that George Hill would get significant minutes on this talent-deprived team, instead of coming off the bench until being traded to a team that could use his skills.
Worse, the model had no idea that a rookie (Collin Sexton) would not only lead the team in minutes, but do so while putting up one of the least production seasons in the league: he finish second last in the league in BPM, second last in VORP, and fourth last in WS. Second on the team in minutes? Cedi Osman, despite having two rough statistical years before this. This is not the minutes allocation of a team that is trying to win.
That’s a particular gap that I could try to improve: the path dependence of a losing team being willing to lose more, improving their draft odds, developing their younger players, and resting their older veterans. Instead the model captures the behavior of the majority of teams, who allocate more minutes to better players.
Conclusions
Overall, I’m happy with how the model performed. Despite not knowing about coaching changes, team tanking plans, injuries, or crowdsourced minute and talent projections, it still accurately predicted the playoff probabilities and rank order of teams. It wasn’t too far off from forecasters who could embed more of this information into their models. I’m once again blown away by just how predictable the NBA is relative to other sports.
Last but not least, Go Raps Go!