Header image is D700 noise tests by Carl Jones used under license CC BY-NC
It’s the end of the playoffs, and we can take a look at how the goalies did.
As you can probably gather from looking at that, or any other leaderboard I’ve seen, the order might be a little funky. No matter what stat we use, the differing number of games will make this a little weird. Yet we have a compulsion to rank, to compare and judge, when most of us (especially me!) know nothing about goaltending and we’re in the early days of applying statistical methods to them.
Sample size, sample size, sample size! When goalies face a limited number of shots, they have high variance. In one game, anything can happen. In two games, anything can happen. In five games, anything can happen - and Brian Boucher having a five game shutout streak is my definition of anything can happen.
Worse, when you dig through a big enough sample of small sample data, you’re going to find something extreme. After a round of the NHL playoffs, there’s always a goalie who has been unstoppable, and another goalie who has been unable to stop a puck. At that point at least 16 goalies have played, with them having at most seven games.
We know this. That’s why in the regular season we often look at stats where we have enough sample to cut out much of the noise. But in the playoffs we don’t have that luxury. We’re not going to take a break from fun (unsubstantiated) narrative, so we better learn to live with noise.
What I’m going to do here is lay out a methodology for evaluating goalies under small game samples. Actually, it’s not limited to goalies or even to hockey. But I’m going to stick to goalies for now, because I might as well save something to write about in case I run out of new ideas.
We know that there should be more variance when goalies have played less. How can we build that into our analysis?
The presence of variance
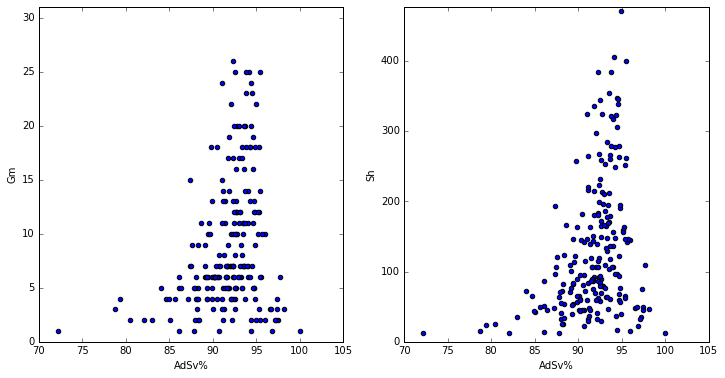
Take a look at these two charts. They’re both the same sample, which is just all the playoff stats (split by season) that I could grab from War on Ice. Notice the mountain shape. Variance is very high for goalies who only played a game or two, and quite low after 15 games. The picture is even clearer when you look at shots, which is a better unit of size than games. There’s at least a slight right lean, which makes sense since the goalies who play better will survive longer in the playoffs.
For fun I also decided to superimpose a binomial 95% confidence interval around the shots graph (based on average adjusted save percentage, or AdSv%). Take a look.
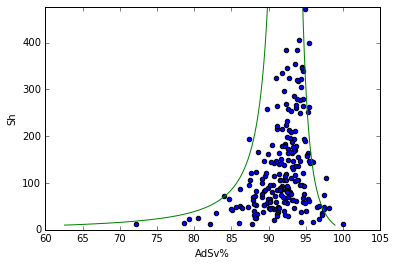
Although it’s tempting to say that this fits the data, your eyes can be misled. It’s actually probably a bit wide - only 95% of the goalie playoff seasons should be within the confidence interval.
There’s no reason for this to actually fit correctly:
- AdSv% is not actually a binomial distribution, just something that sort of looks like one
- The data should be wider: the goalies don’t have the same true AdSv%
- The data should be wider: there is variance in how much of each shot type goalies face
- Yet the data is actually narrower
You can see where I’m going with this.
- Apply distributional assumptions to the data
- Calculate p-values
- ???
- Profit!
And that’s not too far off (well, if we ignore the total absence of profit in this hobby). I wouldn’t entirely mind using the binomial confidence intervals, but I feel like I don’t have to.
Data problems? Get more data!
Treating AdSv% as a binomial distribution is rife with downsides:
- The aforementioned weak theoretical grounding
- I could screw up the math
- If I write some math I should probably put some equations together, in pretty LaTeX, and that’s effort
- Greek letters remind me of grad school, of which I only want to be reminded of out-of-classroom debauchery
- I could screw up typing the equations
So that’s kind of all downside. Instead, let’s just get some data. Data is fun!
My trick here is to build an empirical distribution from regular season games. Let’s presume that there’s a distribution of our goalie stat for single games, another distribution for two games together, another for three games, etc. I took game-by-game numbers for every goalie, and then calculated every possible streak. For example, since Henrik Lundqvist played 72 games in 2007-2008, that’s 72 one-game streaks, 71 two-game streaks, and so on, to put together.
Note that I’m not randomly selecting games from the season, but rather taking consecutive games. This allows us to capture any autoregressive effect whereby goalie performance in one game is connected to the games near it
Suddenly, out of thin air, we have sample!
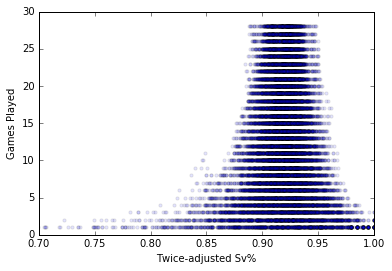 Glorious, glorious sample!
For those really following along, note that it doesn’t have such a dramatic right tilt, because goalies aren’t getting eliminated from the season if they play poorly (Not even this guy). So now I can adjust any performance, whether it’s Martin Jones’ 24 game marathon or Jimmy Howard’s short and unsuccessful two game jaunt, because I have a big sample of both 24 game streaks and two game streaks to compare them to, respectively.
The 2016 playoffs belonged to…nobody?
I won’t bore you with the details, but I’ve made the entire code available, and I put a fair bit of time into refactoring it into something much more maintainable (the modules, at least). It needs work but it’s a start. I quite like github’s Jupyter rendering, so check it out.
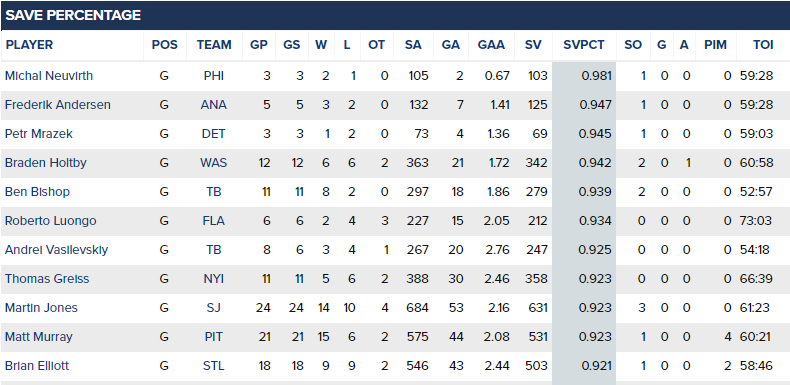
Here are all of the goalies who played 30+ 5v5 minutes in these playoffs. I show stats for their 5v5 AdSv%, their twice adjusted Sv%, then finally their percentile according to my new method (I might need a name for this), which calculates the extremity of their twice adjusted Sv%, given the number of games they’ve played.
Note: Not sure what the best filter on shorthanded shots is. Perhaps best way to handle it would be the Bayesian methodology I explored before. This should also be on a shots basis rather than a games basis. Consider the results shown here as a touch unpolished.
| Name | Games | 5v5 AdSv | 5v5 AdSvRk | T-AdSv | T-AdSvRk | Pctile | PctileRk |
|---|---|---|---|---|---|---|---|
| Michal.Neuvirth | 3 | 0.976 | 1 | 0.961 | 1 | 0.906 | 1 |
| Petr.Mrazek | 3 | 0.975 | 2 | 0.960 | 2 | 0.902 | 2 |
| Ben.Bishop | 11 | 0.944 | 5 | 0.939 | 4 | 0.894 | 3 |
| Braden.Holtby | 12 | 0.936 | 7 | 0.936 | 6 | 0.857 | 4 |
| Antti.Raanta | 3 | 0.960 | 3 | 0.948 | 3 | 0.816 | 5 |
| Martin.Jones | 24 | 0.935 | 8 | 0.930 | 8 | 0.792 | 6 |
| Andrei.Vasilevskiy | 8 | 0.938 | 6 | 0.934 | 7 | 0.782 | 7 |
| Roberto.Luongo | 6 | 0.955 | 4 | 0.937 | 5 | 0.773 | 8 |
| Matthew.Murray | 21 | 0.935 | 9 | 0.925 | 9 | 0.641 | 9 |
| Brian.Elliott | 18 | 0.931 | 10 | 0.921 | 10 | 0.561 | 10 |
| Corey.Crawford | 7 | 0.927 | 11 | 0.919 | 12 | 0.484 | 11 |
| Thomas.Greiss | 11 | 0.926 | 12 | 0.919 | 11 | 0.482 | 12 |
| Frederik.Andersen | 5 | 0.924 | 13 | 0.916 | 13 | 0.448 | 13 |
| Jake.Allen | 4 | 0.920 | 15 | 0.913 | 15 | 0.422 | 14 |
| Henrik.Lundqvist | 5 | 0.921 | 14 | 0.914 | 14 | 0.422 | 15 |
| Jeff.Zatkoff | 2 | 0.907 | 18 | 0.901 | 16 | 0.320 | 16 |
| Steve.Mason | 3 | 0.905 | 19 | 0.900 | 17 | 0.295 | 17 |
| John.Gibson | 2 | 0.892 | 21 | 0.888 | 20 | 0.235 | 18 |
| Jimmy.Howard | 2 | 0.883 | 22 | 0.882 | 21 | 0.205 | 19 |
| Kari.Lehtonen | 11 | 0.915 | 16 | 0.898 | 19 | 0.129 | 20 |
| Pekka.Rinne | 14 | 0.914 | 17 | 0.900 | 18 | 0.108 | 21 |
| Jonathan.Quick | 5 | 0.894 | 20 | 0.882 | 22 | 0.092 | 22 |
| Antti.Niemi | 5 | 0.882 | 23 | 0.880 | 23 | 0.078 | 23 |
| Marc-Andre.Fleury | 2 | 0.843 | 25 | 0.846 | 25 | 0.060 | 24 |
| Devan.Dubnyk | 6 | 0.872 | 24 | 0.871 | 24 | 0.038 | 25 |
You don’t have to apply this system to my stat, but could apply it to any stat of your choosing.
 Aren’t choices wonderful?
So we see that Michal Neuvirth’s excellent, but short, three game stretch would put him in the 90th percentile of goalie performances. Petr Mrazek had a good short stint, and both Ben Bishop and Braden Holtby climb the rankings when we adjust for the fact that they played superbly across so many games.
Yet those are the best performances. Nobody really killed it. Matt Murray got a lot of exposure by the end of the playoffs, but his performance was merely (on the upper side of) average.
On the other end, we do have some notably bad play. Devan Dubnyk stands out for getting crushed across his six games.
The greatest of all…decade?
We have 10 years of WOI data now, so we can at least declare the best and worst of the WOI decade (which shall henceforth always start from the ‘5’ and ‘6’ years, if there is a “henceforth”).
Starting with the best…
| Name | Season | Games | 5v5 AdSv | 5v5 AdSvRk | T-AdSv | T-AdSvRk | Pctile | PctileRk |
|---|---|---|---|---|---|---|---|---|
| Mike.Smith | 20112012 | 16 | 0.953 | 11 | 0.948 | 8 | 0.981 | 1 |
| Ilya.Bryzgalov | 20052006 | 12 | 0.958 | 9 | 0.952 | 5 | 0.981 | 2 |
| Antero.Niittymaki | 20102011 | 2 | 1.000 | 1 | 0.980 | 1 | 0.961 | 3 |
| Tuukka.Rask | 20122013 | 22 | 0.941 | 26 | 0.939 | 13 | 0.960 | 4 |
| Jonathan.Quick | 20112012 | 20 | 0.942 | 25 | 0.938 | 15 | 0.946 | 5 |
| Craig.Anderson | 20142015 | 4 | 0.966 | 5 | 0.958 | 4 | 0.928 | 6 |
| Michal.Neuvirth | 20152016 | 3 | 0.976 | 3 | 0.963 | 2 | 0.921 | 7 |
| Jonathan.Quick | 20122013 | 18 | 0.944 | 20 | 0.938 | 16 | 0.917 | 8 |
| Petr.Mrazek | 20152016 | 3 | 0.975 | 4 | 0.963 | 3 | 0.916 | 9 |
| Jonas.Hiller | 20082009 | 13 | 0.949 | 15 | 0.940 | 12 | 0.914 | 10 |
And the winner is…Mike Smith in 2012! It was his only playoffs as a starter, and what a beauty! He only let in two goals a game despite getting shelled with over 37 shots per game. And now I’ll take credit for him getting his credit. He’s 11th in our sample in 5v5 AdSv%, and even if we filtered by games he wouldn’t rise to the top. His twice adjusted Sv% numbers are slightly behind Ilya Bryzgalov’s excellent 2006 playoffs, but Smith’s is more impressive (according to science!) because he held it over 16 games instead of 12.
Okay, I know you’ve been waiting for it, let’s get to the worst goalie performances in the last decade. Prepare yourselves, this is gonna be ugly.
 You expected an ugly picture here, didn’t you? No we can only handle so much
Pixel the Toller from Pål-Kristian Hamre used under licence CC BY-SA
| Name | Season | Games | 5v5 AdSv | 5v5 AdSvRk | T-AdSv | T-AdSvRk | Pctile | PctileRk |
|---|---|---|---|---|---|---|---|---|
| Marc-Andre.Fleury | 20112012 | 6 | 0.897 | 180 | 0.876 | 206 | 0.046 | 210 (T3) |
| Antti.Niemi | 20102011 | 18 | 0.908 | 156 | 0.895 | 176 | 0.042 | 213 |
| Robert.Esche | 20052006 | 6 | 0.878 | 204 | 0.871 | 214 | 0.038 | 214 |
| Marc-Andre.Fleury | 20102011 | 7 | 0.925 | 94 | 0.877 | 205 | 0.034 | 215 |
| Nikolai.Khabibulin | 20082009 | 15 | 0.902 | 172 | 0.890 | 188 | 0.032 | 216 |
| Martin.Gerber | 20052006 | 7 | 0.873 | 212 | 0.869 | 217 | 0.024 | 217 |
| Jonathan.Quick | 20092010 | 6 | 0.884 | 197 | 0.866 | 218 | 0.022 | 218 |
| Henrik.Lundqvist | 20052006 | 3 | 0.834 | 220 | 0.835 | 221 | 0.014 | 219 |
| JS.Giguere | 20052006 | 9 | 0.873 | 211 | 0.869 | 216 | 0.007 | 220 |
| Marc-Andre.Fleury | 20092010 | 13 | 0.891 | 192 | 0.871 | 213 | 0.000 | 221 |
Dead last is Marc-Andre Fleury’s 2010 playoffs, where he was massacred by any number you look at. And without the use of this technique, he’d be 20 spots further up. Other goalies (including…himself in 2016) have put up worse short playoffs, but he managed to play that badly over 13 games. That’s a testament to how potent the offence in front of him was, especially Sidney Crosby who put up better numbers in those two series than in his 2016 Conn Smythe run!
Wrapping it up
In summary, I toyed with a couple of ways to rank extreme performances that are subject to different levels of variance (e.g. playing more or less games in the playoffs). I don’t like that my method as coded makes no distinction between full games and short substitutions, but it should easily adapt to a per-shot basis. This has useful applications for tournaments, lock-out seasons, NFL quarterbacks and other players, and more.
As always, I’m all ears for comments. Congrats to the Pittsburgh Penguins on winning the 2016 Stanley Cup, and to the San Jose Sharks for getting that far!